Value of goods exports increased by 19.4 per cent in 2021 - Trade deficit was notably larger than the year before
Annual publication 2021: preliminary data on the international trade in goods
According to Finnish Customs’ preliminary data, the value of Finland’s goods exports increased by 19.4 per cent in 2021. The value of exports amounted to almost 68.6 billion euros. The value of imports rose by 21.5 per cent. The value of goods imports amounted to 72.6 billion euros. In the previous year of 2020, exports declined by 11.7 percent and imports by 9.2 per cent. In 2019, exports grew by 2.2 percent, but imports declined by 1.1 per cent.
Presented quarterly, the change in the value of exports and imports took only a slight upward turn in the first quarter of 2021 following the decline in the previous year. Exports increased by 4.4 per cent and imports by 1.8 per cent. In the second quarter, exports rose already by 25.7 per cent, followed by the same 25.7 per cent rise in the third quarter. During the final quarter of the year 2021 exports increased by 22.4 per cent. The value of imports grew by 27.5 per cent in the second quarter, but the growth rate slowed slightly, being 21.9 per cent in the third quarter. In the final quarter, the change of the value of imports was 36.2 per cent. The figures for the last quarter are based on preliminary data.
The export statistics for December 2021 included a delivery of a cruise ship for a value of just over 950 million euros. The export statistics for December 2020 and for 2019 likewise included a delivery of a cruise ship of approximately same value. In December 2021, the import statistics included also a cruise ship for a value of just over 200 million euros. The rise of import prices of energy had a significant impact on the total value of imports in 2021.
Figure 1. Rates of change in imports and exports by quarter 2020-2021
In 2021, the trade deficit increased notably compared to the previous year. According to preliminary data, the trade balance showed a deficit of 4.1 billion euros in 2021. The deficit in the trade with EU countries was 3.3 billion euros. However, the deficit in the trade with non-EU countries was considerably smaller, reaching a figure of 725 million euros. In 2020, the trade balance showed a deficit of 2.3 billion euros. In that year, the trade with other EU countries showed a deficit of 4.2 billion euros, but there was a surplus of 1.9 billion euros in the trade with non-EU countries, with both years calculated using EU27 data. In 2019, the trade deficit was 797 million euros.
Table 1. Overall development, EUR million (figures for 2021 are based on preliminary statistics)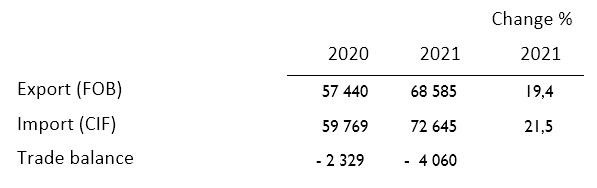
Exports to the EU countries increased by 23.6 percent in 2021. Exports to the eurozone went up by 25.6 percent. Exports to non-EU countries rose by 14.4 percent. Imports from EU countries increased by 18.4 percent and imports from other countries by 26.1 per cent. In 2020, there was a drop of 12.6 per cent in exports to EU countries, and of 10.5 per cent in exports to non-EU countries. The drop in imports from EU countries was smaller than in exports, being 6.9 per cent. Imports from non-EU countries decreased by 12.5 percent in the same period.
Figure 2. Finland’s monthly exports, imports and trade balance 2019–2021, EUR million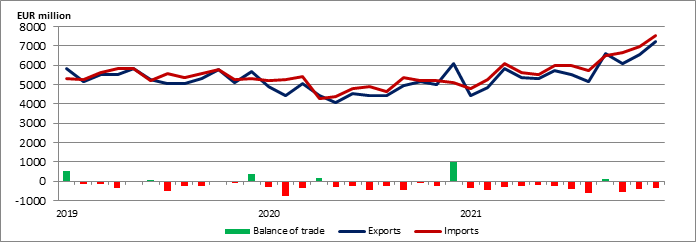
Figure 3. Finland’s annual exports, imports and trade balance 2005–2021, EUR billion
International trade in goods in January–November 2021
Detailed data on the trade in goods is available for January–November 2021. Finnish Customs will publish detailed country and goods statistics on the international trade in goods for the whole of last year on 28 February 2022. There was a rise in the value of exports in all main export categories according to the BEC classification in January–November 2021 compared to the corresponding period the previous year. The value of exports of capital goods grew by 6.1 per cent in January–November, and their share of the total exports of goods was 24.4 per cent. The biggest growth was seen in the value of exports of industrial supplies, 27.8 per cent, and their share of goods exports was 51.9 per cent. Exports of transport equipment grew by 26.7 per cent, and their share amounted to 9.2 per cent. The value of exports of fuels and lubricants increased by 17.7 per cent, and their share of the exports was 6.7 per cent. Consumer goods exports climbed by 13.7 per cent, but their share of exports was only 3.5 per cent. Exports of food and beverages also increased, by 0.8 per cent, while the share of this goods category of total goods exports shrank to 2.3 per cent.
In imports, the value of the trade in fuels and lubricants in January–November showed the biggest increase, 45.7 per cent, compared to the corresponding period in 2020. The share of this goods category of total imports increased to 12.6 per cent. The value of imports of industrial supplies rose by 28.4 per cent, their share being 33.1 per cent. The value of imports of capital goods grew by 11.2 per cent, and their share of total imports was 20.4 per cent. Imports of transport equipment gained a 12.4 per cent share of imports, rising by 15.2 per cent. In January–November 2021, imports of consumer goods increased by 2.0 per cent (10.3% share), and imports of food and beverages by 1.9 per cent (6.1% share).
Figure 4. Change in Finland’s exports 2015–2021 (1-11), per cent, BEC classification, main categories
Note: The Classification by Broad Economic Categories (BEC) aggregates goods to macroeconomic end-use categories
Notable rise in the value of exports of forest industry products in January–November 2021
The total value of exports by the forest industry sector increased by 25.6 per cent in January–November 2021 compared to the corresponding period the previous year. In 2020, exports of forest industry products showed a drop of 16.9 per cent. The value of paper pulp exports increased by 36.1 per cent in January–November 2021. The increase was above all due to a rise in export prices. The value of exports of timber grew by 66.4 per cent due to a notable increase in export prices, while the growth in timber export volumes was moderate. Exports of wood products went up by 35.5 per cent. The value of exports of paper and paperboard increased by 10.8 per cent, mainly due to a rise in export volumes.
The value of exports of machinery, equipment and means of transport showed an overall increase of 12.0 per cent in January–November 2021. In the whole of 2020, the value of exports in the product category dropped by 10 per cent. Exports of industrial machinery and equipment increased by 4.1 per cent. Exports of power-generating machinery and equipment decreased by 7.4 per cent, whereas exports of special machinery increased by 10.9 per cent. Exports of electrical machinery and equipment rose by 19.3 per cent. Exports of transport equipment took an upward turn of 23.2 per cent in January–November 2021.
In January–November 2021, the value of exports of refined petroleum products grew by 9.4 per cent. Export prices rose considerably, while export volumes dropped by about a fifth. In 2020, the value of exports of petroleum products plummeted by 34.2 per cent. Exports of other chemical industry products saw an increase of 22.9 per cent. The growth in exports of medicines and pharmaceutical products slowed down, being 17.3 per cent compared to the rise of 24.5 per cent the previous year. Basic chemicals exports grew by 11.8 per cent and exports of plastics by 38.0 per cent.
The value of exports of metal industry products also took a quick upward turn in January–November 2021. The value of these exports grew by 30.1 per cent, having dropped by 16.5 per cent the year before. The value of iron and steel exports grew by 42.0 per cent, and exports of other metals by 16.8 per cent. The rise in the value of exports of other metals was due to a rapid rise in export prices; the export volumes, on the other hand, were declining. Exports of metal products increased by 20.7 per cent. There was also a notable increase in exports of metalliferous ores and metal scrap, which rose by 43.2 per cent. Exports of instruments and apparatus went up by 3.6 per cent in January–November, but the value of exports of food went down by 1.1 per cent.
Figure 5. Change in exports of main category products 2017–2021 (1–11), per cent, SITC classification.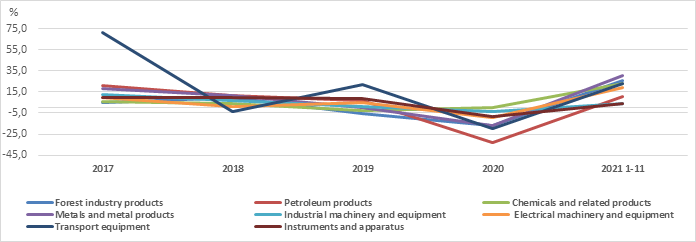
Note: Standard International Trade Classification (SITC)
The value of goods imports also increased in most import sectors in January–November 2021
Imports of machinery, equipment and means of transport experienced an overall increase of 14.1 per cent in January–November 2021 compared to the corresponding period the previous year. The share of this category of total goods imports was 32.1 per cent. The year before, imports of these goods saw a decline of 7.5 per cent. The value of imports of industrial machinery and equipment grew by 14.5 per cent, and imports of electrical machinery and equipment by 14.9 per cent. Imports of transport equipment rose by 12.5 per cent. The value of passenger car imports grew by 22.0 per cent. The value of imports of metals and metal products increased by 36.5 per cent, having dropped by 10.9 per cent in 2020. The value of iron and steel imports increased by 33.8 per cent, and imports of other metals by 53.5 per cent. Imports of metalliferous ores and metal scrap increased by 44.9 per cent.
The value of imports of petroleum and petroleum products grew by 29.2 per cent due to a dramatic rise in import prices, while the import volumes were in decline. The value of imports of electricity jumped by 142.8 per cent due to a notable rise in import prices. The import volumes also increased. Imports of chemicals and related products went up by 15.1 per cent. Imports of basic chemicals grew by 35.4 per cent. Imports of medicines and pharmaceutical products increased by 7.5 per cent. Imports of textile products (other than clothing) decreased by 11.6 per cent, having seen an increase of 31.5 per cent the year before. Imports of instruments and apparatus went up by 7.6 per cent and imports of food by 1.7 per cent.
Figure 6. Change in imports of main category products 2017–2021 (1–11), per cent, SITC classification
Note: Standard International Trade Classification (SITC)
Development of the goods trade with major trading partners in 2021
The value of goods exports to all the largest export countries took a notable upward turn in January–November 2021. Exports to Germany increased by 15.0 per cent, exports to Sweden by 16.0 per cent and exports to the United Status by 16.1 per cent. Exports to the Netherlands grew by 11.7 per cent and exports to Russia by 21.4 per cent. Exports to China went up by 19.9 per cent and exports to the United Kingdom by 16.8 per cent.
More than half of Finland’s total exports value of goods are shipped to these seven countries. Germany had the biggest share of total goods exports, 13.5 per cent, while Sweden’s share was 10.5 per cent and the United States’ share 6.8 per cent. In fourth place was the Netherlands (6.3%), in fifth place Russia (5.5%) and in sixth place China (5.4%). The United Kingdom was the seventh largest export country with a share of 3.8 per cent.
Figure 7. Change in the value of Finland’s exports to Germany, the Netherlands, the United States, Russia, China, the United Kingdom and Sweden 2017–2021 (1-11), per cent
The value of imports of goods also took an upward turn in the case of most of the largest trading partners. Imports from Germany went up by 13.9 per cent in January–November 2021. Imports from Sweden increased by 24.4 per cent, and imports from the Netherlands by 22.0 per cent. Imports from the United States grew by 13.9 per cent. The value of imports from Russia went up by 40.3 per cent, and the corresponding figure for China by 15.4 per cent. Imports from the United Kingdom, however, dropped by 18.6 per cent. About 58 per cent of Finland’s total imports of goods originated in these seven countries. Germany’s share of the total value of the goods imports was 15.1 per cent and Sweden’s 11.5 per cent. Russia’s share was likewise 11.5 per cent and China’s was 8.8 per cent. The United Kingdom’s share of imports dropped to 1.9 per cent, and it ranked only 15th among import countries. Finnish Customs will publish country-specific data on international trade for the whole of 2021 on 28 February 2022.
Figure 8. Change in the value of Finland’s imports from Germany, the Netherlands, the United States, Russia, China, the United Kingdom and Sweden 2017–2021 (1-11), per cent
EU countries’ share of Finland’s international trade in goods was 55.9 percent
The EU27 countries’ share of Finland’s goods exports was 55.9 per cent in 2021, calculated based on the data for January–November. In 2020, their share was 54.6 per cent. The withdrawal of the United Kingdom from the EU came into effect in 2020, and in 2019, the EU countries’ share was even bigger, 59.3 per cent calculated based on 28 member states. The EU27 countries’ share of Finland’s goods imports was 58.4 per cent in 2021, calculated based on the data for January–November. In the previous year of 2020, their share was 59.5 per cent. In 2019 before Brexit, the EU countries’ share was 60.6 per cent calculated based on 28 member states.
The shares of the trade with countries outside the EU changed correspondingly. In 2021, the EU external trade had a 44.1 per cent share of exports and a 41.6 per cent share of imports, while the corresponding shares for 2020 were 45.4 per cent of exports and 40.5 per cent of imports.
Development of the EU countries’ goods exports in January–November 2021
The total exports of goods of the EU countries (EU27) increased by 17 per cent in January–November 2021 according to preliminary data published by Eurostat (Source: Eurostat news release 8/2022). Finland’s goods exports rose by 19 per cent over the corresponding period. Exports grew by more than ten per cent in all EU countries except Ireland, where exports increased by only one per cent. The biggest rise in exports was seen in Greece, Estonia and Croatia. In most of our largest trading partner countries, the growth was slower than in Finland. In Germany, exports increased by 14 per cent and in Sweden by 18 per cent. In the Netherlands, exports grew as much as in Finland, but in Belgium, the increase was 23 per cent. The rise in Finland’s exports was slightly higher than the EU average.
Figure 9. Change in exports in the EU27 countries in 2021 (1-11), per cent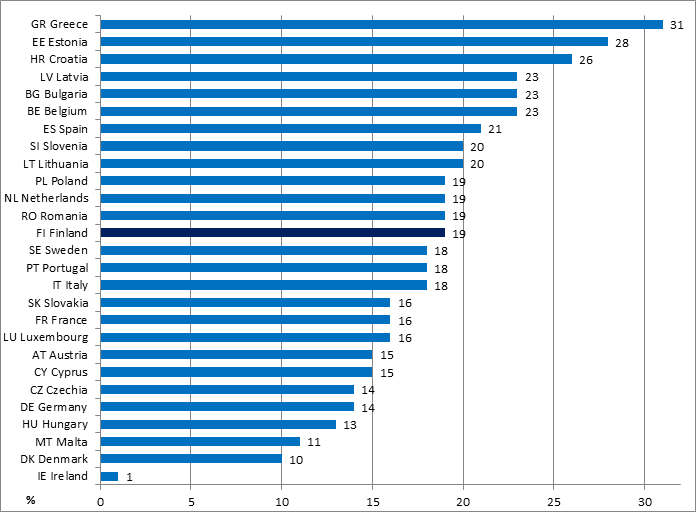
Source: Eurostat news release 8/2022