
Preliminary statistics on the international trade in goods, December 2022
7.2.2023 9.00
Finnish Customs, Statistics
Volume of exports decreased by 20.8 per cent in December according to preliminary data
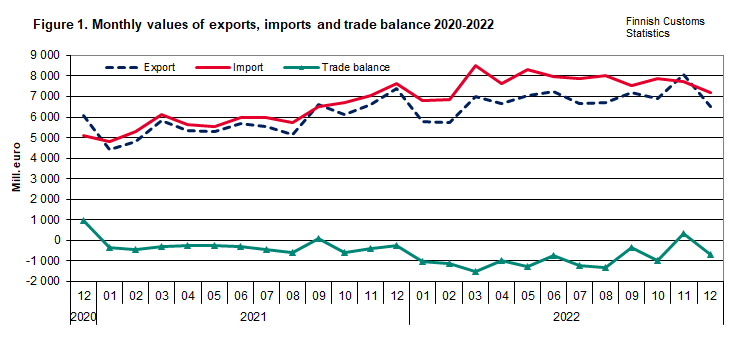
According to the preliminary statistics of international trade in goods provided by Finnish Customs, the value of Finnish exports decreased by 12.2 per cent in December year-on-year. The value of Finnish exports in December was EUR 6.5 billion. Export volume decreased by 20.8 per cent, and export prices increased by 11.9 per cent year-on-year.
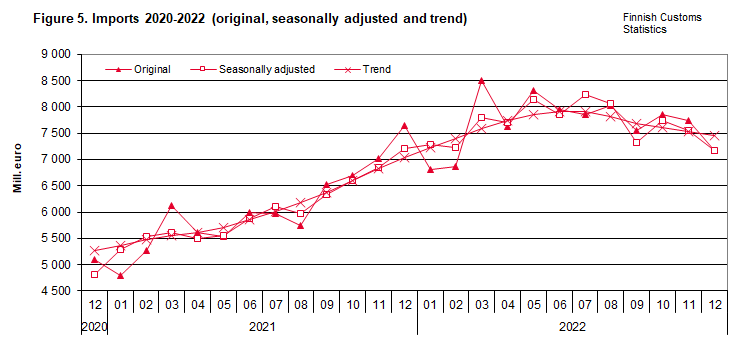
The value of imports decreased by 6.1 per cent in December and the value of imports was EUR 7.2 billion. Import prices increased by 12.1 per cent, but import volume decreased by 15.4 per cent compared to December 2021.
In January-December 2021, the total value of exports increased by 18.2 per cent and the value of imports by 26.5 per cent year-on-year. The volume of exports decreased by 5.2 per cent, but the volume of imports increased by 0.7 per cent calculated according a 12-month moving average.
The trade balance was in deficit of EUR 670 million in December. In January-December, the aggregated deficit amounted to EUR 10.8 billion. In December 2021, the trade balance was EUR 231 million in deficit and in January-December of the same year, the aggregated deficit was EUR 4.0 billion.
N.B. Finnish Customs publish from statistical month 12/2022 preliminary indices for international trade in goods. Volume and unit value indices are calculated based on preliminary data and revisions are possible when data comes more complete. Data is found at Uljas statistical database under the heading preliminary statistics. The preliminary indices are published at 1-level of CPA classification.
The volume of external trade exports decreased less than the volume of EU-internal exports
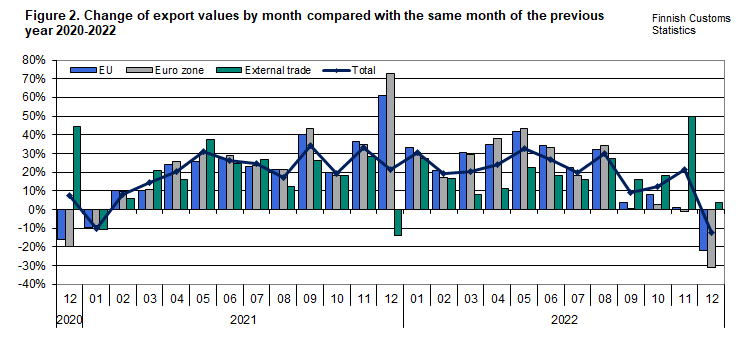
Value of exports to EU member states decreased by 21.7 per cent, but increased to non-EU countries by 3.6 per cent in December. The volume of exports to EU countries decreased by 30.2 per cent and to non-EU countries 5.0 per cent during the same time.
Calculated from the beginning of the year, value of exports to EU countries rose by 17.3 per cent and to non-EU countries by 19.5 per cent. The volume of exports decreased by 6.6 per cent and the volume of imports by 1.9 per cent calculated according to 12-month moving average.
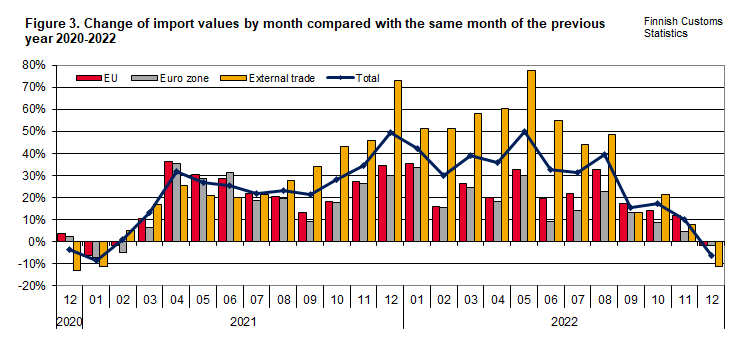
Value of imports from EU countries decreased by 1.7 per cent and from non-EU countries by 11.4 per cent. The volume of imports from EU member states decreased by 10.9 per cent and from non-EU countries by 17.8 per cent.
Calculated from the beginning of the year, imports from EU member states rose by 19.7 per cent and from other countries by 35.9 per cent. The volume of imports from EU member states decreased by 4.2 per cent, but the volume of imports increased by 8.4 per cent calculated according to 12-month moving average.
In this publication preliminary statistics under table 6 are listed export and import values and percentage change by country. Tables 7 and 8 on trade with Russia by more specific commodity level have temporarily been added to the preliminary statistics publication.
The values in the table are preliminary and significant changes are possible when data becomes more complete.
Further information:
Kaarna, Anssi tel. +358 40 332 8153
Telasuo, Christina tel. +358 40 332 1828
E-mail: forename.surname[at]tulli.fi
The monthly preliminary statistics release contains preliminary overall figures about Finland's international trade in goods. More precise figures of exports and imports as well as detailed statistics about specific countries and goods will be published at the end of the month in the monthly statistical release.
Asiasanat
Seuraava julkistus
8.3.2023


