
Monthly statistics on the international trade in goods, January 2023
29.3.2023 9.00
Finnish Customs, Statistics
Export volume increased but import volume decreased in January, export and import prices increased
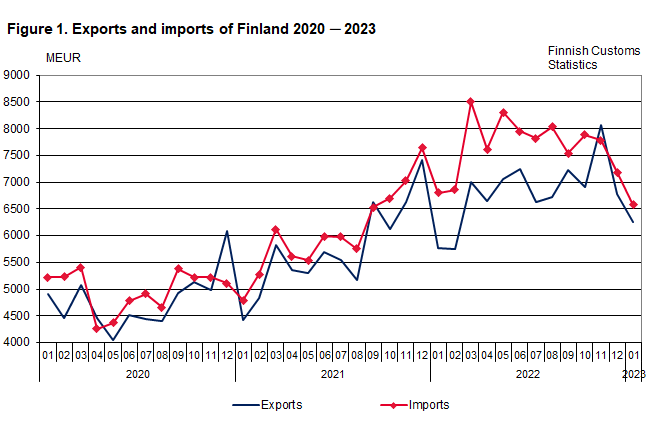
The value of Finnish exports of goods increased by 8.2 per cent year-on-year in January, according to the international trade in goods statistics provided by Finnish Customs. The value of Finnish exports was EUR 6.2 billion. Export volume increased by 0.6 per cent and export prices by 8.8 per cent year-on-year. The value of imports decreased by 3.4 per cent in January to EUR 6.6 billion. Import prices increased by 4.2 per cent, but import volume decreased by 5.7 per cent compared to January 2022. Change of export volume during the latest 12 months was -5.0 per cent (12 month moving average February 2022 – January 2023). The corresponding figure for import volume ‘was -0.4 per cent.
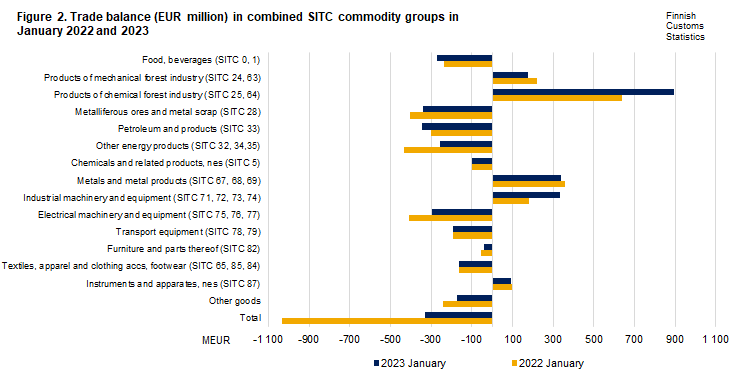
In January 2023, the trade balance showed a deficit of EUR 328 million. The aggregate trade surplus by commodity group for products of chemical forest industry and industrial machinery and equipment increased compared to the previous year. The trade surplus in metals and products of mechanical forest industry decreased. The deficit increased for crude oil and refined petroleum products and food products and beverages, but decreased for ores and metal scrap and electrical machinery and equipment.
The terms of trade improved in January compared to the corresponding month of 2022 as export prices rose more than import prices. The point figure in January was 99.9, while it was 95.7 in January 2022. The terms of trade also improved from December 2022.
The value of exports of capital goods increased by 18.3 per cent in January, and the value of exports of industrial supplies by 2.8 per cent year-on-year. The value of exports of fuels and lubricants decreased by 1.3 per cent. The value of exports of consumer goods increased by 20.4 per cent, and the value of exports of food and beverages by 10.8 per cent. The value of exports of transport equipment and parts increased by 5.7 per cent.
Export value of investment and consumer goods increased in January
The value of imports of industrial supplies decreased by 8.1 per cent in January, but the value of imports of capital goods rose by 5.2 per cent year-on-year. The value of imports of transport equipment and parts decreased by 5.0 per cent. The value of imports of fuels and lubricants decreased by 9.3 per cent. The value of imports of food and beverages increased by 14.5 per cent, but the value of imports of consumer goods decreased by 2.0 per cent.
Import value in external trade decreased more than in internal trade in January
Exports to EU countries increased by 6.9 per cent, and exports to non-EU countries by 10.0 per cent in January. Imports from EU countries decreased by 0.3 per cent and imports from outside the EU by 7.0 per cent in January.
| Direction | January 2022 | January 2023 | Change % |
|---|---|---|---|
| Exports (fob) | 5 770 | 6 245 | 8,2 |
| Imports (cif) | 6 803 | 6 572 | -3,4 |
| Balance | -1 033 | -328 |
| Index | January 2022 | January 2023 | Change % 2023:01/2022:12 |
Change % 2023:01/2022:01 |
Mean* 2022:02-2023:01 |
Change % 2022:02-2023:01/ 2021:02-2022:01 |
|---|---|---|---|---|---|---|
| Volume index exports | 92,7 | 93,3 | -6,5 | 0,6 | 99,6 | -5,0 |
| Volume index imports | 99,5 | 93,9 | -5,4 | -5,7 | 103,5 | -0,4 |
| Unit value index exports | 128,7 | 140,1 | -0,9 | 8,8 | 142,4 | 22,6 |
| Unit value index imports | 134,5 | 140,2 | -4,1 | 4,2 | 147,3 | 22,8 |
* Moving 12-months averages
Note: New methods of estimation used in compilation of international trade in goods statistics were introduced from statistics January 2023. Read more in the bulletin.
Further information:
Kaarna, Anssi tel. +358 40 332 8153
Telasuo, Christina tel. +358 40 332 1828
forename.surname[at]tulli.fi
Asiasanat
Seuraava julkistus
27.4.2023


