
Monthly statistics on the international trade in goods, August 2022
31.10.2022 9.00
Finnish Customs, Statistics
Both export and import prices increased in August
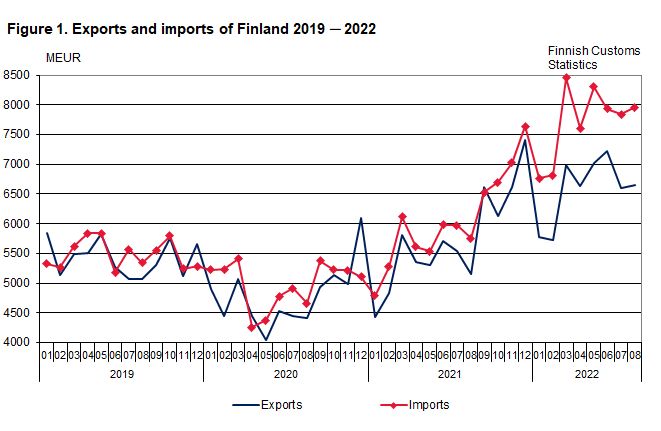
The value of Finnish exports of goods increased by 28.9 per cent year-on-year in August, according to the international trade in goods statistics provided by Finnish Customs. The value of Finnish exports was EUR 6.7 billion. Export volume increased by 4.4 per cent and export prices increased by 23.6 per cent year-on-year. The value of imports increased by 38.4 per cent in August to EUR 8.0 billion. Import prices increased by 26.2 per cent and import volume by 9.7 per cent compared to August 2021. In January-August, the aggregated value of exports increased by 24.9 per cent and the value of imports by 36.9 per cent compared with the corresponding period last year.
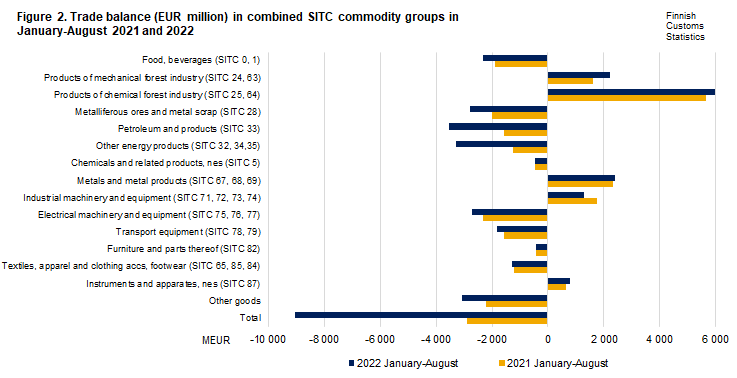
In August 2022, the trade balance showed a deficit of EUR 1.3 billion. In January-August 2022, the trade balance had an aggregated deficit of EUR 9.1 billion. The deficit was EUR 6.2 billion higher than in the corresponding period last year. The aggregate trade surplus by commodity group for forest industry products increased in January-August compared with the corresponding period in 2021. The trade balance surplus in industrial machinery and equipment decreased from a year ago, but the trade balance surplus in metals increased. Trade balance deficit increased in the trade of energy products, ores and scrap metal and electrical machinery and equipment.
The terms of trade worsened in August compared to the corresponding month of 2021 as import prices increased more than export prices. The point figure in August was 95.7, while it was 97.7 in August 2021. The terms of trade deteriorated also from July 2022.
The value of exports of capital goods increased by 27.2 per cent in August and the value of exports of industrial supplies by 24.5 per cent year-on-year. The value of exports of fuels and lubricants increased by 59.6 per cent. The value of exports of consumer goods rose by 24.3 per cent and the value of exports of food and beverages by 23.0 per cent. The value of exports of transport equipment and parts increased by 34.7 per cent.
The value of imports of industrial supplies increased by 25.9 per cent in August, and the value of imports of capital goods rose by 29.2 per cent year-on-year. The value of imports of transport equipment and parts increased by 22.5 per cent. The value of imports of fuels and lubricants rose by 119.6 per cent. The value of imports of food and beverages increased by 23.9 per cent and the value of imports of consumer goods by 21.4 per cent.
Exports to EU countries rose by 31.3 per cent and exports to non-EU countries by 25.8 per cent in August. Imports from EU countries rose by 30.8 per cent and imports from outside the EU by 48.4 per cent in August. In January-August, total exports to EU countries increased by 30.8 per cent and exports to non-EU countries by 17.6 per cent. During the same period, imports from EU countries rose by 24.8 per cent and from outside the EU by 54.6 per cent.
| Direction | August 2021 | August 2022 | Change % | January-August 2021 | January-August 2022 | Change % |
|---|---|---|---|---|---|---|
| Exports (fob) | 5 160 | 6 652 | 28,9 | 42 130 | 52 613 | 24,9 |
| Imports (cif) | 5 750 | 7 960 | 38,4 | 45 043 | 61 677 | 36,9 |
| Balance | -590 | -1 308 | -2 914 | -9 064 |
| Index | August 2021 | August 2022 | Change % 2022:08/2022:07 |
Change % 2022:08/2021:08 |
Mean* 2021:09-2022:08 |
Change % 2021:09-2022:08/ 2020:09-2021:08 |
|---|---|---|---|---|---|---|
| Volume index exports | 91,1 | 95,1 | 2,6 | 4,4 | 102,7 | -0,5 |
| Volume index imports | 95,4 | 104,7 | 0,3 | 9,7 | 106,5 | 5,6 |
| Unit value index exports | 118,1 | 146,0 | -0,8 | 23,6 | 134,2 | 26,6 |
| Unit value index imports | 120,9 | 152,6 | 1,9 | 26,2 | 139,5 | 28,6 |
* Moving 12-months averages
Further information:
Kaarna, Anssi tel. +358 40 332 8153
Telasuo, Christina tel. +358 40 332 1828
forename.surname[at]tulli.fi
Asiasanat
Seuraava julkistus
30.11.2022


