
Exports to Russia collapsed in March 2022, but value of imports increased by 63 %
The value of Finland’s exports of goods to Russia collapsed by 42 % in March 2022 in comparison to the corresponding period in 2021, as indicated by the preliminary international trade in goods statistics compiled by Finnish Customs. The value of exports amounted to 184.4 million euros. The value of Finland’s imports from Russia increased by 63 per cent in March when compared to March 2021 due to drastically increased import prices. The value of imports was 1.0 billion euros.
When measured in euros, the most significant drop (-48.7 MEUR and -64 %) occurred in the CN category of machinery and mechanical appliances and parts thereof, on which the EU has placed the majority of export sanctions. In terms of percentage, a similar drop took place in the category of electrical equipment and parts thereof, also subject to a significant number of EU export sanctions.
Also in terms of percentage, the value of oil product exports decreased the most, by 79 per cent. Exports declined in almost all other goods categories as well, apart from exports of copper mattes which increased by nine per cent from 2021. The share of copper mattes in Finland’s exports to Russia was as high as 29 per cent in March.
As for imports from Russia, the most significant drop involved crude oil. The value of crude oil imports dropped by 45 per cent, and the quantity of crude oil by 70 per cent. Import of crude oil has been replaced mainly with import from Norway. As for other goods categories of imports from Russia, no significant decrease occurred yet in March in the value. The most notable increase in imports involved nickel and nickel goods. Their value increased by 175.2 million euros and 456 per cent in comparison with last year. The import quantity of nickel and nickel goods rose also significantly. The second-highest increase occurred in the value of natural gas imports; 111.8 million euros and 282 per cent. The price of natural gas has increased manifold compared to last year. The value of oil product imports saw the third-highest increase of 95.6 million euros and 180 per cent. The quantity of imports increased more moderately. The value of electrical energy imports increased by 257 per cent in March. However, the quantity of those imports increased by only a third.
– In March, imports from Russia increased also in comparison with February of this year, even though there was a significant drop in crude oil imports. Preliminary reports from our customs clearance systems indicate that, in April, natural gas imports from Russia amounted to 116.4 million euros and imports of nickel mattes amounted to 126.9 million euros. These are currently the most significant items of import from Russia. Due to high prices, even in April this year imports from Russia outsized the numbers of April 2021, says Mr Olli-Pekka Penttilä, Director of Statistics.
Up-to-date traffic information for the Finland-Russia border
During weeks 1-9/2022, an average of about 22 vessels per week arrived in Finland from Russian ports. During weeks 10-16/2022, the average dropped to seven vessels. During week 17, six vessels arrived in Finland. The embargo on Russian ships that began on 17 April 2022 has had only a slight impact on Finland’s imports, as only a few ships registered in Russia arrived in Finland during early 2022.
At the Finnish-Russian border, during March 2022, the arrivals of loaded train cars dropped by 32 % from corresponding period last year. The number was 13 955 loaded train cars. In April 2022, the number of loaded train cars dropped by 65 per cent from last year and 7 973 loaded train cars arrived in Finland from Russia. Departures of loaded train cars to Russia decreased by 26 per cent in March and 49 percent in April. There is no air traffic between Finland and Russia anymore.
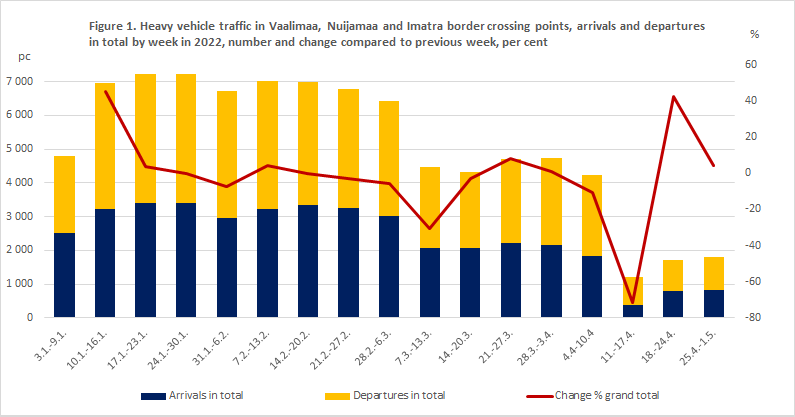
The average weekly number of trucks arriving at the three main border crossing points on the eastern border, namely Vainikkala, Imatra and Nuijamaa, was 3 175, whereas during weeks 10-14 the average number of trucks was 2 088. Since Saturday 9 April 2022 on week 14, Finnish Customs has turned back all commercial transports carried by vehicles registered in Russia and Belarus. Based on the numbers of the past two weeks, the truck traffic on the Finnish-Russian border seems to be dropping by 75 per cent from the February number.
| CN-class | January Preliminary value milj.eur |
February Preliminary value milj.eur |
March Preliminary value milj.eur |
Change % |
|---|---|---|---|---|
| 01-24 Animal- and vegetable products | 7,4 | 7,9 | 5,0 | -45% |
| 25-27 Mineral products | 27,6 | 27,4 | 5,2 | -76% |
| 2710 Oil products | 26,1 | 24,8 | 4,4 | -79% |
| 28-38 Chemical industry products | 27,0 | 25,6 | 18,3 | -26% |
| 39-40 Plastics and -articles, rubber and -articles | 22,7 | 24,4 | 20,0 | -27% |
| 47-49 Pulp, paper, paperboard, -articles | 37,0 | 37,0 | 21,4 | -48% |
| 50-67 Textiles, footwear | 2,5 | 3,9 | 3,5 | 14% |
| 72-83 Base metals and -articles | 63,6 | 75,6 | 61,7 | -8% |
| 7401 Copper mattes | 46,0 | 56,0 | 52,8 | 9% |
| 84 Machines and mechanical appliances, -parts | 60,5 | 78,3 | 27,7 | -64% |
| 85 Electrical machinery, -parts | 17,7 | 15,9 | 5,3 | -64% |
| 86-89 Transport equipment | 31,2 | 13,2 | 6,0 | -67% |
| 90-92 Optical and medicinal instruments and apparatus, etc | 6,9 | 6,6 | 4,3 | -25% |
| Other CN-classes | 7,6 | 7,9 | 6,2 | -33% |
| Total | 311,7 | 323,6 | 184,4 | -42% |
| CN-class | January Preliminary value milj.eur |
February Preliminary value milj.eur |
March Preliminary value milj.eur |
Change % |
|---|---|---|---|---|
| 01-24 Animal- and vegetable products | 7,4 | 9,0 | 8,6 | 20% |
| 25-27 Mineral products | 641,4 | 618,5 | 551,5 | 35% |
| 2701 Coal | 14,5 | 16,2 | 11,8 | 29% |
| 2709 Crude oil | 279,5 | 316,5 | 144,5 | -45% |
| 2710 Oil products | 146,6 | 131,3 | 148,9 | 180% |
| 2711 Natural gas | 90,8 | 68,3 | 151,4 | 282% |
| 2716 Electrical energy | 100,7 | 71,9 | 77,1 | 257% |
| 28-38 Chemical industry products | 114,2 | 106,9 | 85,3 | 33% |
| 31 Fertilisers | 30,0 | 17,7 | 19,8 | 55% |
| 39-40 Plastics and -articles, rubber and -articles | 7,4 | 9,3 | 27,0 | 200% |
| 4011 New pneumatic tyres, rubber | 4,7 | 6,0 | 21,3 | 225% |
| 44-46 Wood and -articles | 39,4 | 37,4 | 38,4 | -11% |
| 47-49 Pulp, paper, paperboard, -articles | 3,9 | 4,4 | 6,2 | 95% |
| 72-83 Base metals and -articles | 190,2 | 177,0 | 267,5 | 319% |
| 72 Iron and steel | 41,6 | 9,0 | 15,8 | 33% |
| 73 Articles of iron and steel | 6,4 | 3,7 | 3,6 | 20% |
| 74 Copper and articles of copper | 9,8 | 12,0 | 24,6 | 746% |
| 75 Nickel and articles of nickel | 122,9 | 142,2 | 213,6 | 456% |
| 84 Machines and mechanical appliances, -parts | 0,8 | 1,3 | 2,2 | -43% |
| 85 Electrical machinery and -parts | 3,5 | 3,5 | 4,3 | -24% |
| Other CN-classes | 6,9 | 6,6 | 9,9 | 51% |
| Total | 1 015,2 | 973,9 | 1 000,8 | 63 % |
The numbers in tables 1 and 2 comprise preliminary data, and changes may occur as data is completed.
More information:
Mr Olli-Pekka Penttilä, Director of Statistics, tel. 040 332 18 62, olli-pekka.penttila@tulli.fi, on Twitter @Penttila_Olli


