
Value of goods exports increased by seven per cent in 2018 – trade deficit slightly lower than the year before
ANNUAL PUBLICATION: preliminary data
According to Finnish Customs’ preliminary data, the value of Finnish goods exports increased by seven per cent in 2018. The value of exports amounted to over 63.8 billion euros. The value of imports also increased, by six per cent. The value of goods imports amounted to almost 66.5 billion euros. In the previous year (2017), exports went up by 15 per cent and imports by 14 per cent. In 2016, exports decreased by four per cent, whereas imports increased by one per cent.
Compared to the previous year, there was a decrease in the trade deficit last year. According to preliminary data, the trade balance showed a deficit of slightly over 2.6 billion euros in 2018. The deficit in the trade with EU countries decreased to under 1.5 billion euros last year. In the trade with non-EU countries, there was a deficit of somewhat over 1.1 euros in 2018. The 2017 trade balance had a deficit of almost 2.8 billion euros. That year, the trade with EU countries showed a deficit of two billion euros, and the trade with non-EU countries showed a deficit of 711 million euros. In 2016, the trade deficit amounted to 3.1 billion euros. That year, the external trade was in surplus by 434 million euros but the EU trade showed a deficit of 3.6 billion euros.
The growth of the exports in almost all main sectors slowed down in January-November 2018 compared to the growth rate of the previous year, except in forest industry products, the export of which rose by a tenth. Exports of machinery grew by six per cent, but exports of transport equipment decreased by four per cent due to the many ship deliveries in the year of comparison. Exports of motor vehicles increased by 16 per cent. Exports of metal industry products increased by more than one tenth. The value of petroleum product exports also increased in line with the increased export prices. Other chemical industry exports increased moderately, except for medicine exports, which decreased. Finnish Customs will publish detailed country and goods statistics on the foreign trade in goods for the whole of last year on 28 February 2019.
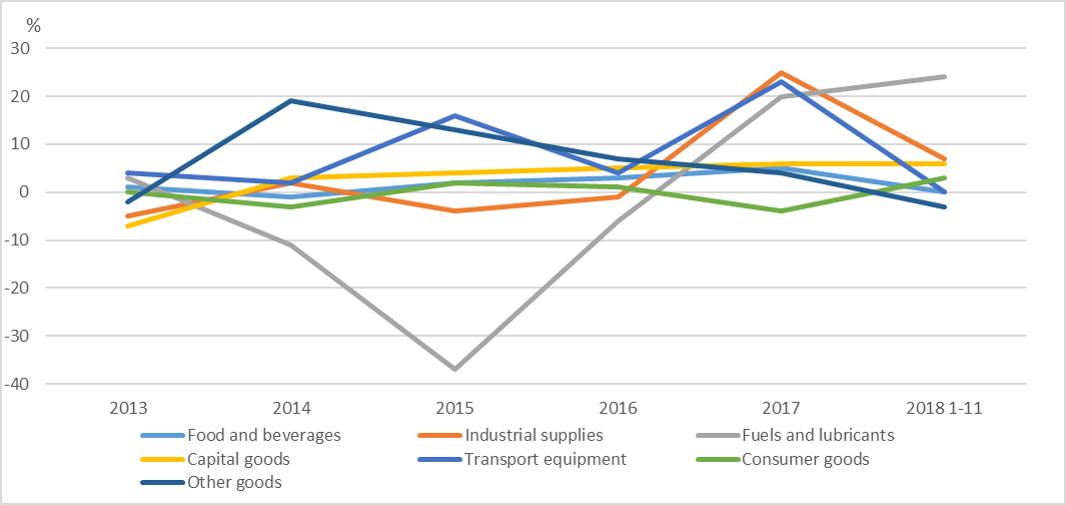
The growth of the value of goods imports also decreased in January-November 2018. The imports of transport equipment and foodstuffs remained at the same level as the corresponding period the year before. Imports of industrial production supplies and capital goods grew somewhat, but the value of imports of fuels and lubricants increased rapidly due to the price increase. Imports of consumer goods increased slightly.
Exports to the EU countries increased by six per cent in 2018. Exports to the eurozone went up by four per cent. Exports to non-EU countries increased by eight per cent. Imports from EU countries increased by four per cent and imports from other countries by ten per cent. In 2017, exports to EU countries increased by 17 per cent, and exports to non-EU countries also increased, by 13 per cent. In 2017, imports from EU countries increased less than exports, 11 per cent. Meanwhile, imports from non-EU countries increased by 18 per cent.
Overall development, million euros (the figures for 2018 are based on preliminary statistics)

Figure 1. Exports, imports and trade balance in Finland by month 2016–2018, million euros.

Figure 2. Exports, imports and trade balance in Finland by year 1990–2018, billion euros.

According to data from January-November 2018, the share of machinery and vehicle industry products of the total goods exports was 21.2 per cent. The share went down by one per cent compared to 2017, but the group is still the largest export sector. The share of forest industry products of the goods exports increased somewhat to 20.4 per cent last year from 20 per cent the year before. This was our second largest export sector. There was also a slight increase in chemical industry exports last year; the share was 19.4 per cent. These three sectors cover 61 per cent of the total goods exports of Finland. In January-November 2018, the share of the metal industry was 15.6 per cent and the electric and electronic industry’s share was 11.6 per cent. The changes were rather small compared to the year before.
Figure 3. Different industrial sectors’ (CPA) shares of Finland’s total exports 2000–2018 (1–11), per cent

The total increase in exports of machinery slowed down to six per cent in January–November 2018. In 2017, the growth was 12 per cent. Exports of industrial machinery and equipment increased by eight per cent and exports of electrical machinery and equipment by two per cent. Exports of mobile technology networking devices increased by more than a quarter. The 34 per cent decrease in ship exports resulted in a four per cent decrease for the exports of the whole transport equipment product group. Exports of motor vehicles increased by 16 per cent.
The total value of exports by the forest industry sector increased by ten per cent in January-November 2018. In 2017, exports of forest industry products grew by five per cent. The growth in the exports of sawn timber was moderate and the exports of wood products decreased somewhat, but the exports of pulp grew by more than a third. The value of paper and paperboard exports increased by eight per cent.
In January-November 2018, the value of exports of petroleum products increased by 14 per cent. In 2017, the value of exports of petroleum products increased by more than a fifth. The export prices of petroleum products increased by 17 per cent in January–November last year, but at the same time, export volumes decreased by two per cent compared to the corresponding period the previous year. The share of oil products of total goods exports went up from 7.8 per cent in 2017 to 8.2 per cent. Exports of other chemical industry products slowed down to an increase of four percent, compared to six per cent in 2017. The exports of basic chemicals and plastics increased, whereas the exports of medicines decreased slightly.
Also the overall increase in exports of metal industry products slowed down in 2018. The increase was 12 per cent, whereas the increase in 2017 was 18 per cent. The increase in exports of iron and steel was 14 per cent and the export on non-ferrous metals ten per cent. Exports of metal products increased by nine per cent.
Exports of metalliferous ores and metal scrap increased quickly; 29 per cent. Exports of instruments and meters went up by seven per cent in January-November, but exports of foodstuffs went down by five per cent.
Figure 4. Change in exports of main export sectors 2010–2018 (1-11), per cent.

The 24 per cent increase in the value of the imports of fuels and lubricants had the greatest impact on the growth of the value of goods imports in January-November. Imports of crude oil increased by 29 per cent. The growth was almost entirely due to the increase in import prices. The import volumes only rose by one per cent. The import prices of petroleum products rose by 23 per cent while the import volumes decreased by nine per cent.
The imports of industrial production supplies grew by seven per cent and the imports of capital goods by six per cent. The imports of transport equipment and their spare parts and accessories remained at the same level as in 2017 overall, when the imports of spare parts and accessories for transport equipment increased by 17 per cent and the import of passenger cars increased by six per cent, but the import of transport equipment decreased by 34 per cent. The imports of foodstuffs also remained at the same level as in 2017, and the imports of consumer goods increased by three per cent.
Figure 5. Change in imports of main import sectors 2013–2018 (1-11), per cent, BEC classification.
In 2018, the EU countries’ share of Finland’s goods exports decreased somewhat to 59.6 per cent from 60 per cent the previous year. As for imports, the EU countries’ share also decreased slightly, from 60.7 per cent in the previous year to 59.5 per cent.
The shares in the trade with countries outside the EU changed correspondingly. Last year, the EU external trade had a 40.4 per cent share of exports and a 40.5 per cent share of imports, while the corresponding shares for 2017 were 40 per cent of exports and 39.3 per cent of imports.
Figure 6. Share of EU exports and EU imports of Finland’s total foreign trade 2002–2018.
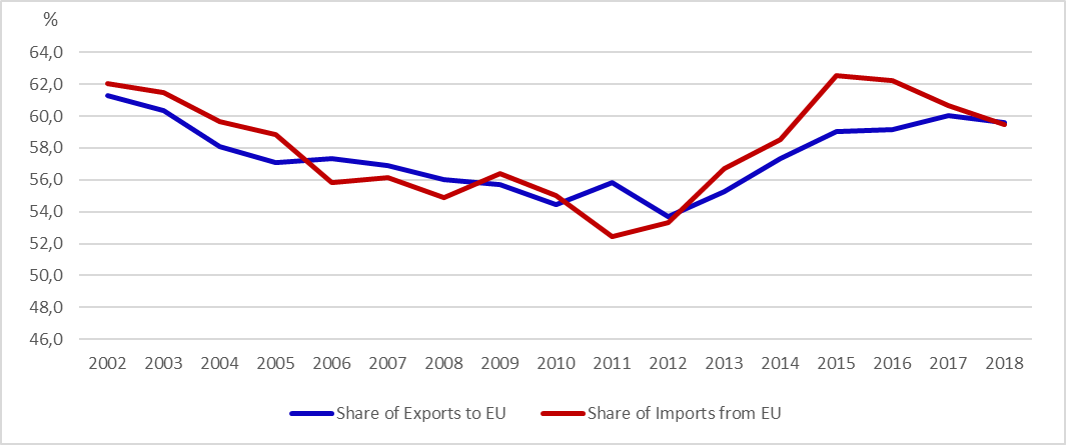
Note: scale of vertical axis begins at 45 per cent.
Germany is our biggest trading partnerGermany rose to become both our biggest export country and our biggest trading partner already in 2014. Germany retained this position in 2018; based on the figures for January–November, its share of total goods exports increased to 15.3 per cent from 14.2 per cent the previous year. Sweden was once again our second biggest export country, with a share of 10.3 per cent, and also our second biggest trading partner. Last year, the Netherlands and the United States had almost an equal share of Finland’s goods exports, 6.7 per cent. However, the United States sprinted past the Netherlands with a very small margin to become the third biggest export country. China took Russia’s place as fifth biggest export country last year with a share of 5.6 per cent. Russia’s share of the total goods exports was 5.1 per cent. United Kingdom came sixth with a share of 4.5 per cent.
Germany was also still our biggest import country in January-November 2018, with a share of 15.6 per cent of total goods imports. Russia was our biggest import country from 2003 to 2015, when the country dropped to third biggest import country with a share of 11 per cent. At its greatest, Russia’s share of the total goods exports was 18 per cent in 2013. In 2017, Russia became the second biggest import country with a share of 13.2 per cent and in 2018, the share rose to 14 per cent.
Sweden came third with a share of 10.9 per cent of the total goods exports in 2018, and China was fourth with a share of 7.0 per cent. The Netherlands came fifth with a 5.4 per cent share in January–November last year and the United States came sixth with 3.3 per cent.
Figure 7. Shares of Finnish goods exports to Germany, the Netherlands, the United States, Russia, China, United Kingdom and Sweden2010–2018 (1–11), per cent.

Exports to Germany increased by 14 per cent in January–November last year and exports to Sweden by seven per cent. Exports to the United States grew by six per cent over the corresponding period and exports to the Netherlands by four per cent. Exports to Russia fell by three per cent in January–November last year. Exports to United Kingdom grew by seven per cent. South Korea, Japan, Canada and Denmark showed the greatest export growth in January-November 2018.
Imports from Germany grew by eight per cent in January-November last year, and imports from Sweden grew by five per cent. Imports from Russia saw an increase of 12 per cent and imports from the Netherlands an increase of three per cent. Imports from China increased by one per cent and imports from the United States increased by 11 per cent. Imports from France decreased by more than a fifth, but from United Kingdom and Denmark only slightly. Finnish Customs will publish country-specific data on foreign trade for the whole of 2018 on 28 February 2019.
Figure 8. Change in the value of Finland’s exports to Germany, the Netherlands, the United States, Russia, China, United Kingdom and Sweden 2010–2018 (1-11), per cent.

The combined goods exports of the EU countries (EU28) grew by five per cent in 2018 (January–November).[1] Finland’s goods exports rose by seven per cent over the corresponding period. The growth of Finnish exports in January-November of 2018 was the ninth highest of the EU countries and higher than the average total exports of the EU countries. Five other EU countries also reached a growth of seven per cent in exports. One year earlier the development of Finland’s exports was the second highest, but in year 2016 it was the third weakest of all the EU countries during the same period.
Excluding Luxembourg, exports showed growth in all EU countries. Six EU countries reached a growth of more than ten per cent; for example in Estonia, exports went up by 13 per cent. In Finland’s other major trading partner countries the growth in exports was weaker than in Finland. In Germany, Sweden, France and Belgium, exports increased by four per cent. In United Kingdom, exports grew by seven per cent and in the Netherlands, by six per cent. In Denmark, exports only grew by two per cent.
Figure 9. Change in exports in different EU countries in 2018 (1–11), per cent
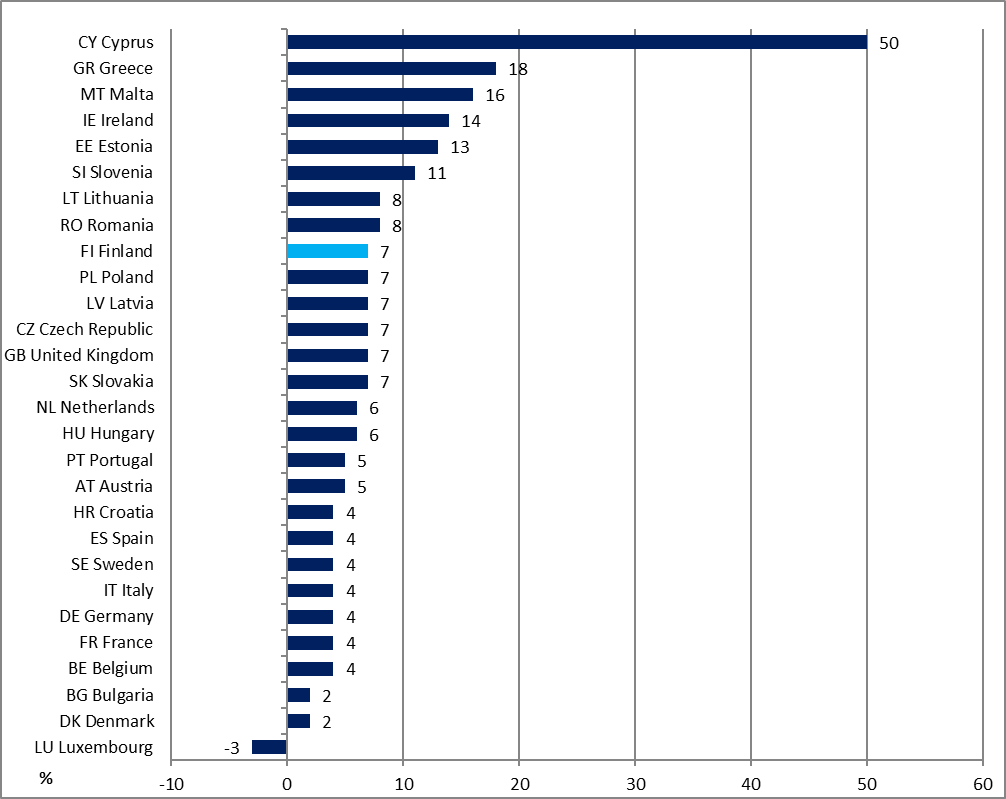
Source: Eurostat news release 9/2019


